Wavix is a software tool that has been developed by Modelit and is used by Dutch authorities to validate wave data. The core of the model is made up by Neural Network (NN) models. Extensions have been made to provide for the estimation of reliability intervals and the estimation of mutually dependent missing data.
INTRODUCTION
Information about waves is important for assessing the danger of flooding and for protecting the coast. Wave data establish boundary conditions for all kinds of design problems and are used in the analysis of coastal behaviour and to estimate wave climates and developments within them that could be indicative of a trend. On-line information on wave conditions is used by the shipping community and to judge working conditions at sea. In the Netherlands, the water management authority (RWS-RIKZ) is responsible for monitoring wave data. Information on wave data is distributed, among others through a website (www.golfklimaat.nl).
Data checking, also referred to as validation, is an essential step in the monitoring of wave data. Without it datasets could become incomplete and polluted with data produced by malfunctioning detectors. Part of the validation task is carried out on-line and involves a number of checks that are carried out unattended. The definitive data validation takes place off-line. This paper describes the methodology of a recently completed software tool for the off-line validation of spectral wave data using Neural Networks.
VALIDATION OF WAVE DATA
Wave data are monitored using step-gauges, buoys, and radar detectors and may be represented by wave-height, wave-period and directional parameters. During the validation six characteristic spectral parameters are checked. The RWS-RIKZ measurement policy includes storage of many more parameters, see (Heinen, 1992). In practice the data-availability is about 90%. The remaining 10% of data is missing because of detector malfunctions or failing communication channels. Some of these malfunctions are discovered timely, leading to the data being marked as missing. Malfunctions that are not discovered on-line lead to erroneous data that are not marked as such. The main objectives of the off-line validation are to pin-point these erroneous data, and to replace missing and erroneous data with the best available estimates. A secondary objective is to develop models that can be used in the process of on-line validation.
NEURAL NETWORK BASED VALIDATION
Ideally the level of redundancy is such that malfunctions can be pin-pointed without complex analysis. However, reality is that the Dutch coastal area extends over about 400 by 50 km and is monitored using some dozen measuring sites. Because of the distance between these measuring sites, their data cannot be compared directly. However the data from one detector can to some degree be predicted from neighbouring detectors, after which outliers that require visual inspection can be identified. This is the first step in the validation process. Earlier prototypes (Van Noort, 1998) have shown that Neural Networks are very useful in this context. For each parameter-location combination a separate, many-to-one, Feed-Forward NN may be designed and calibrated. The main design parameters of each model are made up by the choice of the explanatory variables and the time lapses that are applied.
EXTENSIONS TO THE STANDARD NEURAL NETWORK MODEL
Where possible the methodology described in this paper consists of existing and proven technology: Neural Networks and the methods to train them. Where needed this technology was extended to suit the specific needs of the current problem. These extensions relate to two specific innovations that are described in the next subsections.
Reliability intervals
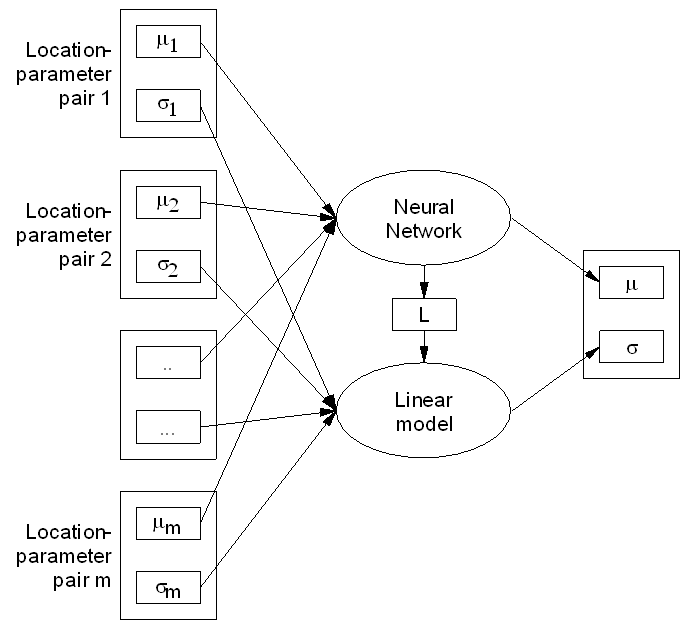
Neural Networks typically produce point estimates, while for validation purposes one would want to use reliability intervals to identify outliers in a meaningful way. In the present case, reliability intervals are approximated for each predicted item by making a linear approximation of the NN in each point (see Figure 1) and deriving the standard deviation from this linear model and the standard deviations of its inputs.
Predicting mutually dependent missing data
The final step in the validation process is estimating the missing values. Not all missing data can be estimated directly because in some cases the input data needed to make these estimates may be missing too. Missing data for which no NN-estimates are available are referred to as mutually dependent. Applying the NN in an iterative manner only resolves this problem to a limited extent, because errors may accumulate if estimates are based on estimates, and more importantly: cyclic dependencies may exclude this approach altogether.
This problem is overcome by an approach that resembles the Maximum Likelihood approach: The missing values are replaced by values that minimize an objective function that measures the difference between predicted and observed values, weighted with the reciprocal value of the (predicted) standard deviation. The difficult part in this approach is designing a sufficiently efficient numerical procedure for solving this optimization problem. Again the linear model comes to rescue, because it enables the approximation of the gradient of target function, and hence the implementation of an efficient optimization procedure. For a typical dataset covering 3 months with 1600 missing data points the optimization is solved in about 100 iterations each consisting of applying all NN’s. For the end-user this translates in a waiting time of less then 2 minutes. For comparison: an earlier version of the software that applied undirected search and has been in use for some 6 years used 12 hours for a similar computation.

Fig. 1: A linear approximation of a Neural Network can be used to estimate reliability intervals and speed-up optimization procedures
SOFTWARE TOOL
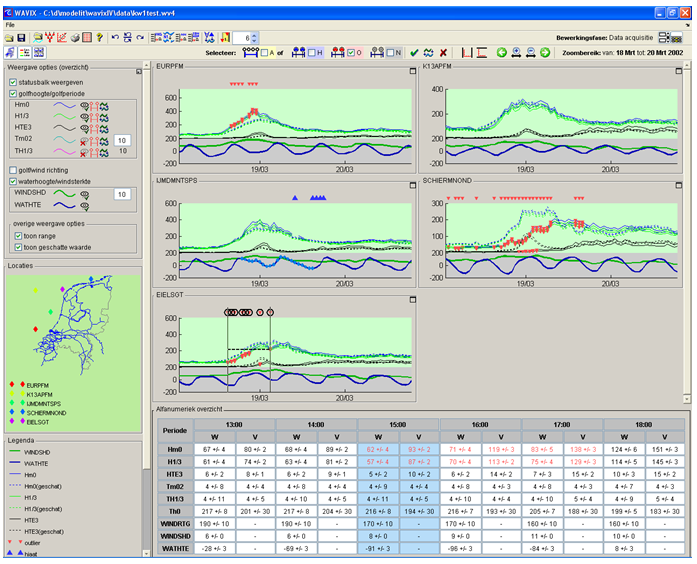
The NN-based validation process has been implemented in the software package “WAVIX”. This package offers facilities for data management, visual inspection of data, specification, training and application of Neural Networks, identifying outliers and missing data and the interactive acceptance or rejection of data and estimated values. All automated and manual modifications are logged and can be made undone if desired. WAVIX has been completed in October 2004 and took a year to develop.
The following steps constitute the workflow within Wavix:
-1- Data acquisition. During this phase the raw time series data are imported from ASCII files. After this step a first visual inspection of the data is possible.
-2- Model building and training. This step is not part of the usual validation process, but needs to be carried out only once. During this step the user defines a number of predictive models by specifying whether or not functional dependencies between one signal and another exists. For each dependency a set of time shifts can be defined. Once the dependencies are known, the corresponding feed-forward Neural Networks are trained.
-3- Model application and interactive data validation. The Neural Networks are used to make estimates to compare with the measured time series. Extreme values are marked as outliers and highlighted in the graphs with specific icons. It is up to the user to decide which outliers correspond to faulty data and should be removed from the set, and which outliers are caused by exceptional circumstances, like storms, and should be kept.
-4- Estimating mutually dependent missing data. Some missing data can not be predicted directly using the pre-trained Neural Networks because in certain cases also the some of the input data for these networks may be missing. In these cases the methodology described in a previous section is applied at a typical cost of 2 minutes for a three month dataset with hourly data for 7 detectors. During this phase no user interaction is required.
-5- Exporting the validated data. The last step in the process is to export the data to a database for long term storage and further dissemination.

Fig. 2: View of the Wavix main screen
POTENTIAL FOR ALTERNATE APPLICATIONS
Although Wavix has been tailor made for the validation of spectral wave data in the Netherlands, the flexibility of Neural Networks compared to closed form mathematical models would make it relatively easy to use the software for other validation tasks.
Examples of these tasks would be the validation of wave data in other countries, or the application of the software to a different topic area altogether, such as the validation of water levels in rivers. In fact Wavix could be adapted with relatively small effort to any problem that is characterized by one or more of the following properties: -1- Validation and data-completion is required for multiple time-series of numerical data; -2- These data are interrelated, but a mathematical model that describes their relationships is not at hand; -3- Arbitrary chunks of data may be missing or erroneous; -4- Point estimates and reliability intervals are required; -5- Visual inspection and manual editing of the data should be possible.
CONCLUSIONS
Neural Networks provide a suitable way to describe the interrelations between time series of spectral wave data. By coupling NN-models to a user-friendly graphical user interface and extending the scope of the models so that also reliability intervals can be derived and mutually dependent missing data can be resolved, a software package has been implemented that allows for the validation of wave data in an effective manner. Because of the inherent flexibility of NN-models, this package can easily be configured for the validation of wave data in other countries and, in fact, for many more problems that require interactive and model based data validation.
Note: This text is based on a paper that was presented and published on the occasion of the Fifth International Symposium on Ocean Wave Measurement and Aanalysis, Madrid, Spain, 3-7 July 2005.
Functions of Wavix
For more details on Wavixsee:
Documentation Wavix Application
Wavixis part of a software suite of applications that Modelit maintains for Rijkswaterstaat


